How to pull data from the MOAT API using Python
Published 2021-01-04
Using the MOAT API is fairly straightforward.
Grab API token and test
Ask your MOAT account manager for an API token (it will be a long series of letters and numbers). With this token we can then pull data from the MOAT API. As far as I know the token doesn’t expire so treat it like a password.
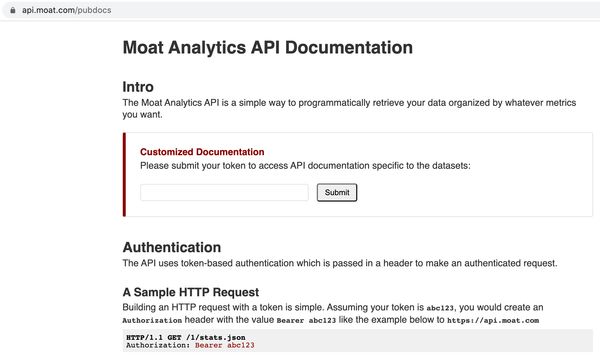
Test your token here: Moat Analytics API Documentation

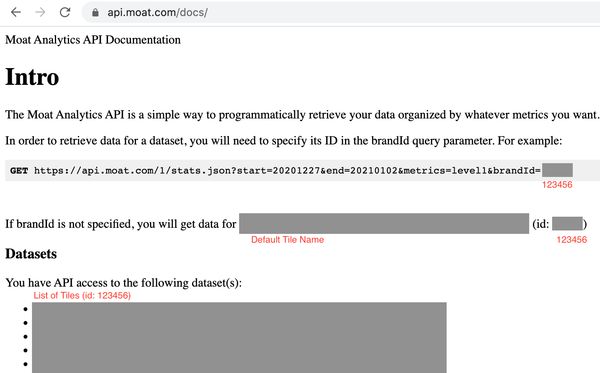
After entering your API token, you’ll see a list of datasets (MOAT calls them tiles in their own UI) that you have access to.

The datasets will have this form:
- Tile/Dataset Name (id: 123456)
- etc
Where the id number is our Brand ID.
The two variables we’ll use from here are the Token and the Brand ID.
Make API calls
import requests
import datetime
import pandas as pd

# set our variables
# Token from MOAT account manager
TOKEN = 'your token here'
# Brand ID from https://api.moat.com/pubdocs after entering in token
# is an int
BRAND_ID = yourbrandid
# Sliding window more relevant once we grab data periodically
SLIDING_WINDOW = 7
# pick the metrics and dimenions we want here
METRICS = (['date','level1','level2','level3','level4',
            'slicer1','slicer2','x_y','os_browser',
            'impressions_analyzed','1_sec_in_view_impressions',
            'measurable_impressions'])
# MOAT uses the same URL with GET requests only
URL = 'https://api.moat.com/1/stats.json'
# The header is also simply the bearer token
HEADER = {'Authorization':f'Bearer {TOKEN}'}

# sliding window size
yesterday = (datetime.date.today() - datetime.timedelta(days=1))
start_date = (yesterday - datetime.timedelta(days=SLIDING_WINDOW))
yesterday_text = yesterday.strftime('%Y-%m-%d')
start_date_text = start_date.strftime('%Y-%m-%d')

# query is made from our above variables
QUERY = {
    'metrics': ','.join(METRICS),
    'start': start_date_text,
    'end': yesterday_text,
    'brandId': BRAND_ID
}

# GET request here
response = requests.get(url=URL,
                        headers=HEADER,
                        data=QUERY)

# response.json() looks like this:
#{'query': {'metrics': 'date,level1,level2,level3,level4,
# slicer1,slicer2,x_y,os_browser,impressions_analyzed,
# 1_sec_in_view_impressions,measurable_impressions',
#  'start': '2020-12-21',
#  'end': '2020-12-28',
#  'brandId': 'yourbrandid'},
# 'results': {'summary': {'measurable_impressions': 1463127,
#   '1_sec_in_view_impressions': 446770,
#   'impressions_analyzed': 1463127},
#  'details': [{'date': '2020-12-21',
#    'measurable_impressions': 100024,
#    'level1_id': 'yourcampaignid',
#    'level2_id': 'yoursiteid',
#    'level3_id': 'yourplacementid',
#    'level4_id': 'yourcreativeid',
#    'os_browser': 'iPhone-App,etc',
#    'slicer1_id': 'yourdomainid',
#    'slicer2_id': 'yoursubdomainid',
#    'x_y': '320_575',
#    'level1_label': 'yourcampaignname',
#    'level2_label': 'yoursitename',
#    'level3_label': 'yourplacementname',
#    'level4_label': 'yourcreativename',
#    'slicer1_label': 'yourdomain',
#    'slicer2_label': 'BRAND_AWARENESS',
#    '1_sec_in_view_impressions': 32687,
#    'impressions_analyzed': 100024},
#    {next row},
#    {next row},
#    ...
#  ]},
# 'data_available': False}

pd.DataFrame(response.json()['results']['details']).head()
Output looks like this, as all the data we need is nested inside ‘results’ then ‘details’.

Our data is now ready to use elsewhere. Good luck!
Related Posts

Connecting to Google BigQuery using Python
Published 2021-01-05
Google BigQuery is a good choice of cloud database if your data is being used for analytics and doesn't require fast writes. Let's explore how to perform CRUD (Create/Read/Update/Delete) actions with Python 🐍
bigquerypythonapisql
Using the Adobe Analytics v1.4 API with Python -- the older and actually useful API
Published 2020-12-15
Why would Adobe Analytics give us API 2.0 to use, when it doesn't give access to multiple dimensions in a usable way? It's a mystery to me unless I've missed something 🤷 -- API 1.4 (the Omniture API) to the rescue ⛑️
adobe analyticspythonapi