Using the Adobe Analytics v1.4 API with Python -- the older and actually useful API
Published 2020-12-15
There are two variants of this API we will explore, the Reporting API 1.4 and the Data Warehouse API 1.4, check out all the official docs here.
The Reporting API is limited to displaying the top 50,000 values per dimension. How this might be a problem: If you had an ecommerce store with 70,000 items in store, the Report API would pull 50k items and we’d be confused why our data doesn’t match and where our other 20,000 items are. The Reporting API also takes longer to generate a report than the Data Warehouse API.
The Data Warehouse API overcomes this limitation, allowing us to pull an uncapped number of dimensions and metrics. However it doesn’t let us pull every metric/dimension. I haven’t tested many, but one metric I found that didn’t work with the Data Warehouse API was “bounces”. A surprisingly common metric not to be included.
# tested 2 Feb 2021
'{"error":"metric_not_supported_in_warehouse","error_description":"Metric \"bounces\" not supported in warehouse requests",
"error_uri":"https:\/\/marketing.adobe.com\/developer\/en_US\/documentation\/analytics-reporting-1-4\/metrics"}'
This leaves the conclusion up to you on which API to use, since there’s no single API that does it all. My recommendation on what to use:
- Data Warehouse API 1.4 (best for most cases)
- Reporting API 1.4 (if the fields you want aren’t in the Data Warehouse API)
- Reporting API 2.0 (if you only want one dimension)
API 1.4 is a two step URL, the first API request queue’s a report to build, then our second request pulls the data. This contrasts to API 2.0 which responds with data immediately but doesn’t allow more than one dimension to be pulled at a time.
Authentication
I’m still recommending JWT Authentication. You can find more detailed explanations in my other blog post: How to pull data from the Adobe Analytics API (2.0) using Python. Skip ahead if this is old news.
We use the Adobe Analytics API 2.0 as we did before for these setup steps.
Generate your access token first.
# Libraries we need
import datetime
# jwt requires installing the cryptography library
# the quick way is "pip install pyjwt[crypto]" for both at once
import jwt
import os
import requests
import pandas as pd

# type in your client id and client secret
CLIENT_ID = 'your client id'
CLIENT_SECRET = 'your client secret'
JWT_URL = 'https://ims-na1.adobelogin.com/ims/exchange/jwt/'

# read private key here
with open('your path to/private.key') as f:
    private_key = f.read()

# this is from Adobe Developer Console with true changed to True
jwt_payload = {"iss":"youriss@AdobeOrg",
                "sub":"[email protected]",
                "https://ims-na1.adobelogin.com/s/ent_analytics_bulk_ingest_sdk":True,
                "aud":"https://ims-na1.adobelogin.com/c/youraud"}
# generate an expiry date +1 day and make it an integer
jwt_payload['exp'] = int((datetime.datetime.now() +
                          datetime.timedelta(days=1)).strftime('%s'))

# create another payload that we'll trade for our access key
access_token_request_payload = {'client_id': f'{CLIENT_ID}',
                            'client_secret': f'{CLIENT_SECRET}'}

# encrypt the jwt_payload with our private key
jwt_payload_encrypted = jwt.encode(jwt_payload, private_key, algorithm='RS256')
# add this encrypted payload to our token request payload
# decode makes it a string instead of a bytes file
access_token_request_payload['jwt_token'] = jwt_payload_encrypted.decode('UTF-8')

# make the post request for our access token
# for this to work we need to use "data=" to generate the right headers
# using json= or files= won't work
response = requests.post(url=JWT_URL, data=access_token_request_payload)
response_json = response.json()
# set our access token
ACCESS_TOKEN = response_json['access_token']

# response_json looks like this:
#{'token_type': 'bearer',
# 'access_token': 'lotsofletterssymbolsandnumbers',
# 'expires_in': 86399998}
Find the Global Company ID.
# We can use this URL to get our global company id
DISCOVERY_URL = 'https://analytics.adobe.io/discovery/me'
DISCOVERY_HEADER = {
    'Accept':'application/json',
    'Authorization':f'Bearer {ACCESS_TOKEN}',
    'x-api-key':f'{CLIENT_ID}',
}

response1 = requests.get(url=DISCOVERY_URL, headers=DISCOVERY_HEADER)
# in my case I only have one global company id, you might have more
GLOBAL_COMPANY_ID = response1.json()['imsOrgs'][0]['companies'][0]['globalCompanyId']
# response.json() looks like this
#{'imsUserId': '[email protected]',
# 'imsOrgs': [{'imsOrgId': 'yourimsOrgId@AdobeOrg',
#   'companies': [{'globalCompanyId': 'yourglobalCompanyId',
#     'companyName': 'your Company Name',
#     'apiRateLimitPolicy': 'aa_api_tier10_tp',
#     'dpc': 'sin'}]}]}
Find the Report Suite ID
# Our header now contains everything we need for API calls
HEADER = {
    'Accept':'application/json',
    'Authorization':f'Bearer {ACCESS_TOKEN}',
    'x-api-key':f'{CLIENT_ID}',
    'x-proxy-global-company-id': f'{GLOBAL_COMPANY_ID}',
}

# all of the API 2.0 reports stem from this URL
BASE_URL = f'https://analytics.adobe.io/api/{GLOBAL_COMPANY_ID}/'
# find URLs to use here: https://adobedocs.github.io/analytics-2.0-apis/#/
FIND_RSID_URL = BASE_URL + 'collections/suites'

response2 = requests.get(url=FIND_RSID_URL, headers=HEADER)
# you could also find the RSID you need with
# [x['rsid'] for x in response2.json()['content'] if('keyword' in x['name'])][0]
RSID = response2.json()['content']['rsid'][0]
We should have these variables to use now.
CLIENT_ID = 'your client id'
CLIENT_SECRET = 'your client secret'
GLOBAL_COMPANY_ID = 'your global company id'
RSID = 'your report suite id'
HEADER = {
    'Accept':'application/json',
    'Authorization':f'Bearer {ACCESS_TOKEN}',
    'x-api-key':CLIENT_ID,
    'x-proxy-global-company-id':GLOBAL_COMPANY_ID,
}
The Omniture API (v1.4)
Reporting API 1.4
In this first code block we’ll explore the Reporting API 1.4.
# The two URL endpoints we'll need
# We can use the same ones for Reporting or Data Warehouse APIs
POST_RQ_STEP1 = 'https://api5.omniture.com/admin/1.4/rest/?method=Report.Queue'
POST_RG_STEP2 = 'https://api5.omniture.com/admin/1.4/rest/?method=Report.Get'

# Define our variables
METS = [{'id':'orders'},
         {'id':'revenue'}]
ELEMS = [{'id':'evar007','top':50000}, # max elements supported is 50k
        {'id':'evar420','top':50000}, # if we put a higher number here, the API will complain
        {'id':'product','top':50000}]

# the body of our post request
BODY = {
    'reportDescription':{
        'dateGranularity':'day', # gives us a daily date column
        'anomalyDetection':False,
        'curretData':True,
        'dateFrom':'2021-01-01',
        'dateTo':'2021-01-10',
        'reportSuiteID':RSID,
        'elementDataEncoding':'utf8',
        'metrics':METS,
        'elements':ELEMS,
        'expedite':False,
    }
}

# our first post request
r1 = requests.post(url=POST_RQ_STEP1,headers=HEADER,json=BODY)

# r1.json() looks like this and we'll feed it into our step 2 Report.Get
# {'reportID': 1234567890}
Now that we’ve requested a report, we’d hope it is ready for us to download in a reasonable amount of time. The time before a report is ready likely depends on server load and how many rows of data our report returns. I haven’t done much testing on this, but the official documentation for Data Warehouse reports says to use Data Warehouse 1.4 over Reporting 1.4 when we expect reports to take >5hrs to return. I suppose there could be an epic queue or someone on the backend is hand crafting this report for us 😂.
Because of this unknown time delay, we’ll create some functions to help us wait and retry.
# some functions to help us out

# give us a timestamp
def timestamp():
    return datetime.now().strftime('%Y-%m-%d_%H:%M:%S')

# will use formula 2*(4^n) for backoff
# 8 sec, 32sec, 124sec (~2min), ~8min, ~34min [will never exceed 5 steps in cloud run (60min max run time)]
def try_with_backoff(url,header,payload):
    print(f'{timestamp()} trying request')
    req = requests.post(url=url,headers=header,json=payload)
    n = 1
    sleep_base = 4
    while (req.status_code != 200): # and (n<=5):
        sleep_time = 2*(sleep_base**n)
        sleep_time_mins = round(sleep_time/60,2)
        print(f'{timestamp()} req.status = {req.status_code} -- sleep for {sleep_time} secs ~ {sleep_time_mins} mins')
        time.sleep(sleep_time)
        print(f'{timestamp()} retry request')
        req = requests.post(url=url,headers=header,json=payload)
        n += 1
    if(req.status_code != 200):
        return f'error -- {req.text}'

    return req

# our second post request
r2 = try_with_backoff(url=POST_RG_STEP2, header=HEADER, payload=r1.json())

# output will look like this
# 2021-01-29_11:51:52 trying request
# 2021-01-29_11:52:00 req.status = 400 -- sleep for 8 secs ~ 0.13 mins
# 2021-01-29_11:52:08 retry request
# 2021-01-29_11:52:15 req.status = 400 -- sleep for 32 secs ~ 0.53 mins
# 2021-01-29_11:52:47 retry request
# 2021-01-29_11:52:55 req.status = 400 -- sleep for 128 secs ~ 2.13 mins
# 2021-01-29_11:55:03 retry request
# 2021-01-29_11:55:11 req.status = 400 -- sleep for 512 secs ~ 8.53 mins
# 2021-01-29_12:03:43 retry request
# <Response [200]>
A potential issue here, if we’re running this on a cloud function/container we might time out before we see a result. AWS Lambda has a max run time of 15 mins as does Google Cloud Run officially (although Cloud Run can be set to 60 mins, a beta feature supposedly). If you have too much data then a cloud VM might be your only option.
The fun doesn’t stop once we get our response object. It’s a heavily nested object with a new level of nesting per element (dimension) we have. At first I thought what we needed was “json_normalize”, which flattens a json object, but the real hero is “explode”, which takes a nested list and copies each item in the nest onto a new row. The below code un-nests a response object of any depth for both Reporting API 1.4 and Data Warehouse API 1.4 responses.
# function that creates lists filled with zeros
def gen_zero_list(n):
    out = []
    for i in range(0,n):
        out.append(0)
    return out

# function to fillna with our special zero lists
def fill_nan(x,mets):
    try:
        if(len(x)>0):
            return x
    except:
        return gen_zero_list(len(mets))


# explode the number of levels there are and stitch together the df we want
def explode_n_concat(df,col_name,elems,mets):
    # put some info into variables
    metrics = [x['name'] for x in mets]
    dimensions = [x['name'] for x in elems]

    # need to loop one more time than we have elements
    loops = len(elems)
    for i in range(0,loops):
        # base case change the col names to show level0
        if i == 0:
            df.columns = df.columns + f'_{i}'
            df['date'] = pd.to_datetime(df['name_0'])

        # explode the breakdown
        df = df.explode(col_name+f'_{i}').reset_index(drop=True)
        # put the breakdown in a new dataframe
        df_temp = pd.DataFrame.from_records(df[col_name+f'_{i}'].dropna().tolist())
        # rename the columns to show the level
        df_temp.columns = df_temp.columns + f'_{i+1}'
        # change the name of the name columns to match the elements
        df_temp.rename(columns={f'name_{i+1}':dimensions[i]},inplace=True)
        # stitch the new columns onto our existing df
        df = pd.concat([df,df_temp],axis='columns')
        # rename the metrics columns
        if i == loops-1:
            df_mets = pd.DataFrame(df[f'counts_{i+1}'].apply(lambda x: fill_nan(x,metrics)).to_list(),columns=metrics)
            df = pd.concat([df,df_mets],axis='columns')

    # last bit of cleaning up
    cols = ['date']
    cols.append(dimensions)
    cols.append(metrics)
    selected_cols = list(pd.core.common.flatten(cols))
    df[metrics] = df[metrics].astype(float)
    return df[selected_cols]

# request cleaner using our other function explode_n_concat
def req_2_df(req):
    df = pd.json_normalize(req.json(),['report','data'])
    elems = req.json()['report']['elements']
    mets = req.json()['report']['metrics']
    df_clean = explode_n_concat(df=df,col_name='breakdown',elems=elems,mets=mets)
    return df_clean

df = req_2_df(r2)
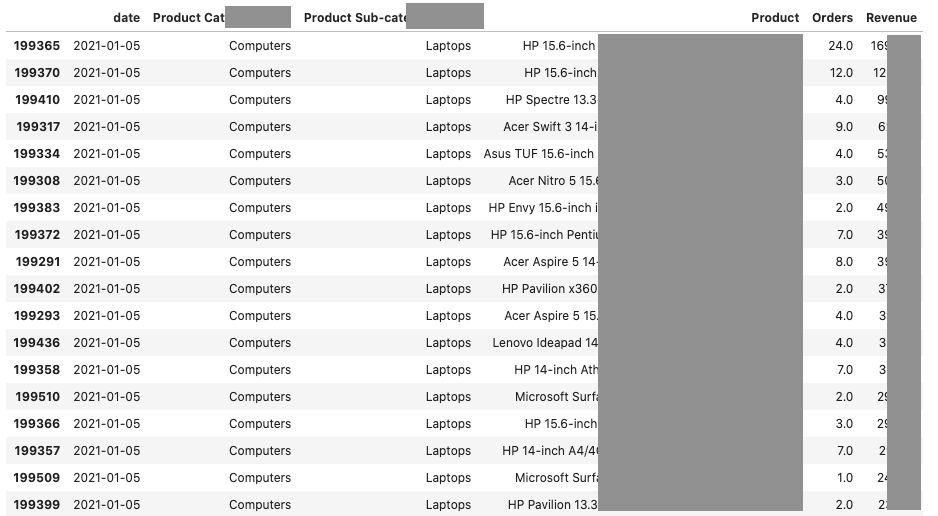
A snippet of the output looks like this:

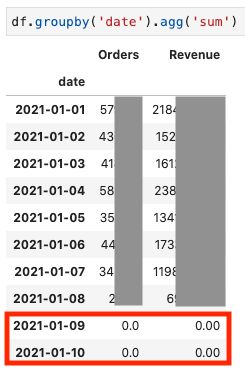
Our data appears to be good! It's in a dataframe and ready to be used elsewhere. However in Reporting API 1.4 there is a maximum limit of 50k variations on dimensions. Hence we find 2 full days of missing data.

Data Warehouse API 1.4
Read the comments for inline explanations.
# our metrics object
METS_DW = [
    {'id': 'pageviews'},
#   {'id': 'bounces'},
    {'id': 'visits'},
    {'id': 'orders'},
    {'id': 'revenue'}]

# our elements object
ELEMS_DW = [
    {'id':'evar19'}, # no need for top now
    {'id':'evar20'},
    {'id':'product'}]

# our data warehouse body with source:warehouse
BODY_DW = {
    'reportDescription':{
        'source':'warehouse', # use this as the equiv of using the datawarehouse endpoint
        'dateGranularity':'day',
        'anomalyDetection':False,
        'curretData':True,
        'dateFrom':'2021-01-01',
        'dateTo':'2021-01-07',
        'reportSuiteID':RSID,
        'elementDataEncoding':'utf8',
        'metrics':METS_DW,
        'elements':ELEMS_DW,
        'expedite':False, # we don't have permission for true here
    }
}

# step1 Report.Queue with our data warehouse body
r1_dw = requests.post(url=POST_RQ_STEP1,headers=HEADER,json=BODY_DW)
# r_dw1.json looks like {"reportID":1234567890}

# step2 Report.Get with the report id
r2_dw = try_with_backoff(url=POST_RG_STEP2, header=HEADER, payload=r1_dw.json())
# after some time we'll get <Response [200]>

# then we can use the .keys() method to see the structure of the json
r2_dw.json().keys()
# output looks like dict_keys(['report'])

# we'll look inside 'report'
r2_dw.json()['report'].keys()
# output looks like
# dict_keys(['data', 'reportSuite', 'period', 'elements', 'metrics', 'page', 'totalPages'])

# we'll check how many pages there are and what page this is
r2_dw.json()['report']['page']
# output = 1, it could have been zero indexed
r2_dw.json()['report']['totalPages']
# output = 2
Now we know we only have data for page 1 of 2. I will leave the final bit of coding up to you, we need a loop that will make more requests if page less than totalPages. This is how to access another page:
# accessing another page
requests.post(url=POST_RG_STEP2, headers=HEADER,
              json={"reportID":1234567890,"page":2})
We now know how to pull data out of Adobe Analytics and some of the limitations we’ll face 😐
Related Posts

How to pull data from the Adobe Analytics API (2.0) using Python
Published 2020-12-15
The Adobe Analytics API is one of the trickiest to navigate. Most APIs I've played around with don't take this many steps to get working. Enjoy the step-by-step guide 🔑🔓
adobe analyticspythonapi