How to pull data from the Adobe Analytics API (2.0) using Python
Published 2020-12-15
--update 1 May 2023--
As I upgrade my blog to Sveltekit, I re-read this post and made some small corrections here and there (such as my misunderstanding 2 years ago of JWT vs Oauth 2.0 vs GCP service accounts)
--update 29 Jan 2021--
This is a guide for the Adobe Analytics v2.0 Reporting API, which is only useful for pulling data for one dimension like the example below. If you want more dimensions, you’ll want to use the v1.4 Reporting API or v1.4 Data Warehouse API. Link here: Using the Adobe Analytics v1.4 API with Python
I found the process of grabbing data from the Adobe Analytics API pretty challenging, so here’s a guide on how to do it. I’m assuming you’ll have access (a username and password for Adobe Analytics already). I don’t believe there’s a way to use any Adobe API without a paid account, you’ll need to be an existing user.
This article aims to give you template code that is ready to be hosted and scheduled so that pulling data is fully automated.
Let me know if anything is unclear and I’ll try answer any questions you have.
Set up Adobe Developer Console
This is where we’ll set up API credentials, which will differ from your username and password.
I believe you can access Adobe Developer Console with your Adobe Analytics username and password, I didn’t set up this part but will find out and update the post.
Here’s a guide from Adobe: Getting started with Adobe Developer Console
Pulling Data from the API
We’re going to do the following 4 steps:
1. Authentication
Username & Password
↓
Client ID, Client Secret, Private Key & JWT Payload
↓
Access Token
2. Grab Global Company ID
Client ID & Access Token
↓
Global Company ID
3. Grab Report Suite ID
Client ID, Access Token & Global Company ID
↓
Report Suite ID
4. Grab Report (with selected Metrics and Dimension)
Client ID, Access Token, Global Company ID & Report Suite ID
AND
Date Range, Metrics, Filters, Dimension
↓
Your Report
1. Authentication via JSON Web Token (JWT)
There are two main types of Authorization flows: “Authorization Code” and “Client Credentials”. In the “Authorization Code” flow, the user is prompted to enter their credentials (such as their username and password) into a login page hosted by the authorization server. In contrast, in the “Client Credentials” flow, the client application is authenticated directly with the authorization server using a client ID and secret. We’re using the Client Credentials flow, which requires no human intervention and is set up primarily for machine-to-machine communication. A JSON Web Token (JWT) is a compact, secure way to transfer information between parties. It contains some secret information (only you should know) and some scoping information. The scope should define how much access to certain data you have and how much time you have to use it (typically using less than 1 hour is considered more secure).
We’re going to look in Adobe Developer Console for these items
- Client ID aka : Like a username for the API
- Client Secret: Like a password for the API
- Private Key: Like a signature for your password
- JWT Payload: Some specific details that Adobe want you to show them to trade for the Access Token.
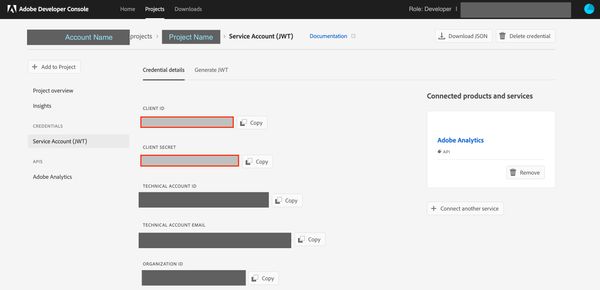
In Projects > Credential Details > Get the Client ID and Client Secret:
In Projects > Credential Details > Generate a public/private keypair
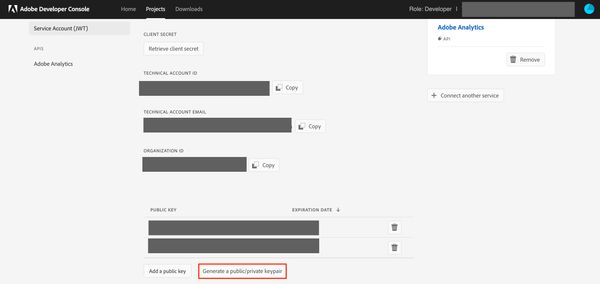
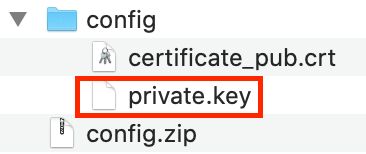
When you click the button you’ll download a zip file that contains a public key file and private key file. You can open these in any text editor to see what they look like. Keep the private key file handy, we’ll refer to it later in our Python code.
In Projects > Generate JWT > Copy the payload you see there
A few notes about the payload (at the time of writing):
- The expiry (exp) is +1 day (local time) from the time of generating this payload. You can find out the human readable date & time by typing the 10 digit number (epoch time in seconds) into an epoch time converter. From experimentation if the expiry is less than +12hrs it won’t work.
- One value in the payload is “true” which is boolean true in Javascript. Since we’re using Python, we’ll need to convert that to “True”.

The code to make it happen
# Libraries we need
import datetime
# jwt requires installing the cryptography library
# the quick way is "pip install pyjwt[crypto]" for both at once
import jwt
import os
import requests
import pandas as pd

# type in your client id and client secret
CLIENT_ID = 'your client id'
CLIENT_SECRET = 'your client secret'
JWT_URL = 'https://ims-na1.adobelogin.com/ims/exchange/jwt/'

# read private key here
with open('your path to/private.key') as f:
    private_key = f.read()

# this is from Adobe Developer Console with true changed to True
jwt_payload = {"iss":"youriss@AdobeOrg",
                "sub":"[email protected]",
                "https://ims-na1.adobelogin.com/s/ent_analytics_bulk_ingest_sdk":True,
                "aud":"https://ims-na1.adobelogin.com/c/youraud"}
# generate an expiry date +1 day and make it an integer
jwt_payload['exp'] = int((datetime.datetime.now() +
                          datetime.timedelta(days=1)).strftime('%s'))

# create another payload that we'll trade for our access key
access_token_request_payload = {'client_id': f'{CLIENT_ID}',
                            'client_secret': f'{CLIENT_SECRET}'}

# encrypt the jwt_payload with our private key
jwt_payload_encrypted = jwt.encode(jwt_payload, private_key, algorithm='RS256')
# add this encrypted payload to our token request payload
# decode makes it a string instead of a bytes file
access_token_request_payload['jwt_token'] = jwt_payload_encrypted.decode('UTF-8')

# make the post request for our access token
# for this to work we need to use "data=" to generate the right headers
# using json= or files= won't work
response = requests.post(url=JWT_URL, data=access_token_request_payload)
response_json = response.json()
# set our access token
ACCESS_TOKEN = response_json['access_token']

# response_json looks like this:
#{'token_type': 'bearer',
# 'access_token': 'lotsofletterssymbolsandnumbers',
# 'expires_in': 86399998}
Grab Global Company ID
Heirarchy of Adobe Analytics:
Global Company ID
Report Suite ID
- Reports: This is where we’ll pull our table of data
Find all the relevant URL endpoints here: Swagger UI
# We can use this URL to get our global company id
DISCOVERY_URL = 'https://analytics.adobe.io/discovery/me'
DISCOVERY_HEADER = {
    'Accept':'application/json',
    'Authorization':f'Bearer {ACCESS_TOKEN}',
    'x-api-key':f'{CLIENT_ID}',
}

response1 = requests.get(url=DISCOVERY_URL, headers=DISCOVERY_HEADER)
# in my case I only have one global company id, you might have more
GLOBAL_COMPANY_ID = response1.json()['imsOrgs'][0]['companies'][0]['globalCompanyId']
# response.json() looks like this
#{'imsUserId': '[email protected]',
# 'imsOrgs': [{'imsOrgId': 'yourimsOrgId@AdobeOrg',
#   'companies': [{'globalCompanyId': 'yourglobalCompanyId',
#     'companyName': 'your Company Name',
#     'apiRateLimitPolicy': 'aa_api_tier10_tp',
#     'dpc': 'sin'}]}]}
Grab Report Suite ID
# Our header now contains everything we need for API calls
HEADER = {
    'Accept':'application/json',
    'Authorization':f'Bearer {ACCESS_TOKEN}',
    'x-api-key':f'{CLIENT_ID}',
    'x-proxy-global-company-id': f'{GLOBAL_COMPANY_ID}',
}

# all of the reports stem from this URL
BASE_URL = f'https://analytics.adobe.io/api/{GLOBAL_COMPANY_ID}/'
# find URLs to use here: https://adobedocs.github.io/analytics-2.0-apis/#/
FIND_RSID_URL = BASE_URL + 'collections/suites'

response2 = requests.get(url=FIND_RSID_URL, headers=HEADER)
# you could also find the RSID you need with
# [x['rsid'] for x in response2.json()['content'] if('keyword' in x['name'])][0]
RSID = response2.json()['content']['rsid'][0]
#response2.json() looks like this:
#  {'content': [{'collectionItemType': 'reportsuite',
#   'id': 'idname1',
#   'rsid': 'rsid1',
#   'name': 'company/division name1'},
#  {'collectionItemType': 'reportsuite',
#   'id': 'idname2',
#   'rsid': 'rsid2',
#   'name': 'company/division name2'}],
# 'pageable': {'sort': {'sorted': False, 'unsorted': True, 'empty': True},
#  'pageSize': 10,
#  'pageNumber': 0,
#  'offset': 0,
#  'paged': True,
#  'unpaged': False},
# 'sort': None,
# 'previousPage': False,
# 'firstPage': True,
# 'nextPage': False,
# 'lastPage': True,
# 'last': True,
# 'totalPages': 1,
# 'totalElements': 2,
# 'first': True,
# 'number': 0,
# 'numberOfElements': 2,
# 'size': 10,
# 'empty': False}
Grab Report (with selected Metrics and Dimension)
In the context of visualising data I’m going to explain two varieties of API data, which will give you a better idea how to use Adobe Analytics API data in your app or visualisation.
- Database level API data. A table or tables with all the metrics and dimensions you need to create your visualisation. An example is if we had a bar chart, pie chart and a table in our visualisation, we can use our database level API data to feed into all 3 of these widgets. We would achieve this by joining, filtering and aggregating our data as needed.
- Widget level API data. Each API call is only returning us a minimum amount of data necessary, if we were creating a visualisation, we’d need one API call for one widget. In the example of having a bar chart, pie chart and a table, we would need one API call for each of the 3 widgets. Data for the bar chart probably won’t be relevant or useable for the pie chart and vice versa.
The Adobe Analytics API provides widget level data. At the time of writing I haven’t worked out how (if it’s even possible) to bring in more than one dimension into an API call. So if we want to build Database level data, we’ll need to use filters and iterate through our data to build our dataset.
Back to our code, we need a Date Range, Metrics and a Dimension at a minimum to pull a report. We can find a list of API URL endpoints here: Swagger UI
# Date range requires a time and since I'm only concerned
# with days, I set the time to midnight
START_DATE = '2020-12-01'
END_DATE = '2020-12-06'
MIDNIGHT = 'T00:00:00.000'
DATE_RANGE = START_DATE + MIDNIGHT + '/' + END_DATE + MIDNIGHT

# The report suite id we found above is now used in our API calls
# Find the list of endpoints here https://adobedocs.github.io/analytics-2.0-apis/
RSID_ADDON = f'?rsid={RSID}'
# URL endpoint to grab all dimensions
GET_DIMENSIONS_URL = BASE_URL + 'dimensions' + RSID_ADDON
# URL endpoint to grab all metrics
GET_METRICS_URL = BASE_URL + 'metrics' + RSID_ADDON

# Let's search for some dimensions that we want to pull
response3 = requests.get(url=GET_DIMENSIONS_URL, headers=HEADER)
# response3.json() is an object with all possible dimensions

# Change the search word to browse dimensions we might want to use
DIM_SEARCH_WORD = 'channel'
df3 = pd.DataFrame(response3.json())
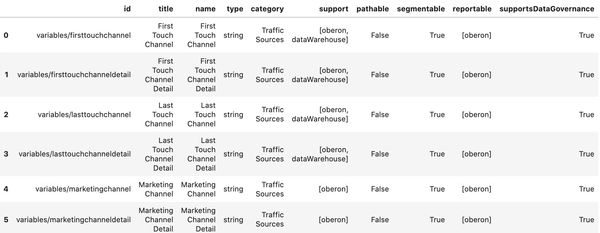
df3[df3['name'].str.contains(DIM_SEARCH_WORD, case=False)]
DIM = 'variables/lasttouchchannel'
Output of our df3 search:
Pick some metrics now
# Request to find all possible metrics
response4 = requests.get(url=GET_METRICS_URL, headers=HEADER)
# response4.json() is an object with all possible metrics

# Change the search word to browse metrics we  want to use
# since we're using pandas str.contains we can use regex and
# separate search words with | OR operator
MET_SEARCH_WORD = 'visits|orders|revenue'
df4 = pd.DataFrame(response4.json())
df4[df4['name'].str.contains(MET_SEARCH_WORD, case=False)]
Output below

We then create a metrics object, as this is the way the API wants the data formatted.
# select these 3 metrics
METS = ['metrics/visits','metrics/orders','metrics/revenue']
# create the metrics object
METS_OBJ = [{'id':x} for x in METS]
# which looks like this
# [{'id': 'metrics/visits'},
#  {'id': 'metrics/orders'},
#  {'id': 'metrics/revenue'}]
We now have all the pieces to generate a report
# The report will be a post request
POST_REPORT_URL = BASE_URL + 'reports' + RSID_ADDON

# with the date range, metrics and dimension in the body
REPORT_BODY = {
   "rsid":RSID,
   "globalFilters":[
      {
            "type":"dateRange",
            "dateRange":DATE_RANGE
      }
   ],
   "metricContainer":{
      "metrics":METS_OBJ,
   },
   "dimension":DIM,
   "settings":{
      "dimensionSort":"asc",
      "limit": 50000,
   }
}

response5 = requests.post(url=POST_REPORT_URL, headers=HEADER, json=REPORT_BODY)
# table output of the response.json()['rows]
pd.DataFrame(response5.json()['rows'])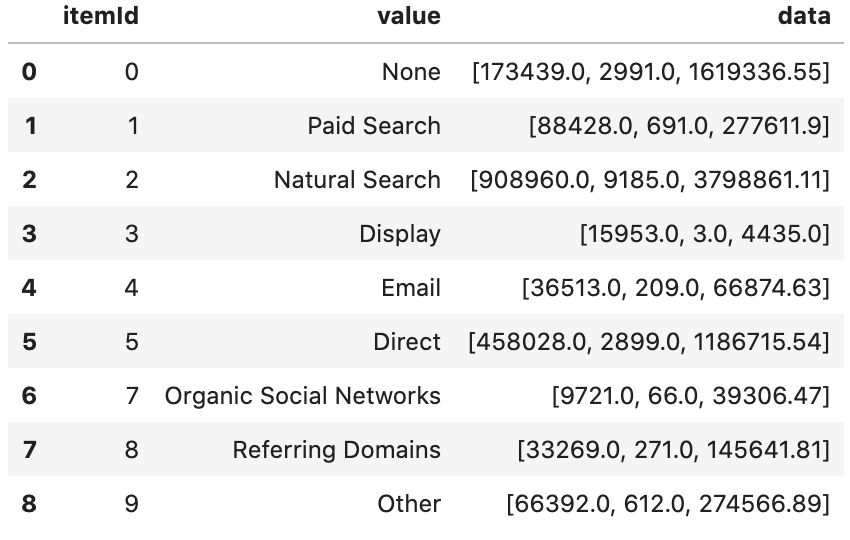
We'll do some minimal cleaning up of the data so it's more useable.
# create the dataframe
df5 = pd.DataFrame(response5.json()['rows'])
# set the column names
df5.columns = [DIM+'_key',DIM,'data']
# unnest the 'data' column into another dataframe
df5a = pd.DataFrame(df5['data'].to_list())
# set the column names
df5a.columns = METS
# concatenate the two dataframes by the column axis
# and remove the 'data' column from the raw output
df5b = pd.concat([df5.iloc[:,:-1],df5a],axis='columns')
# df5b now looks like this: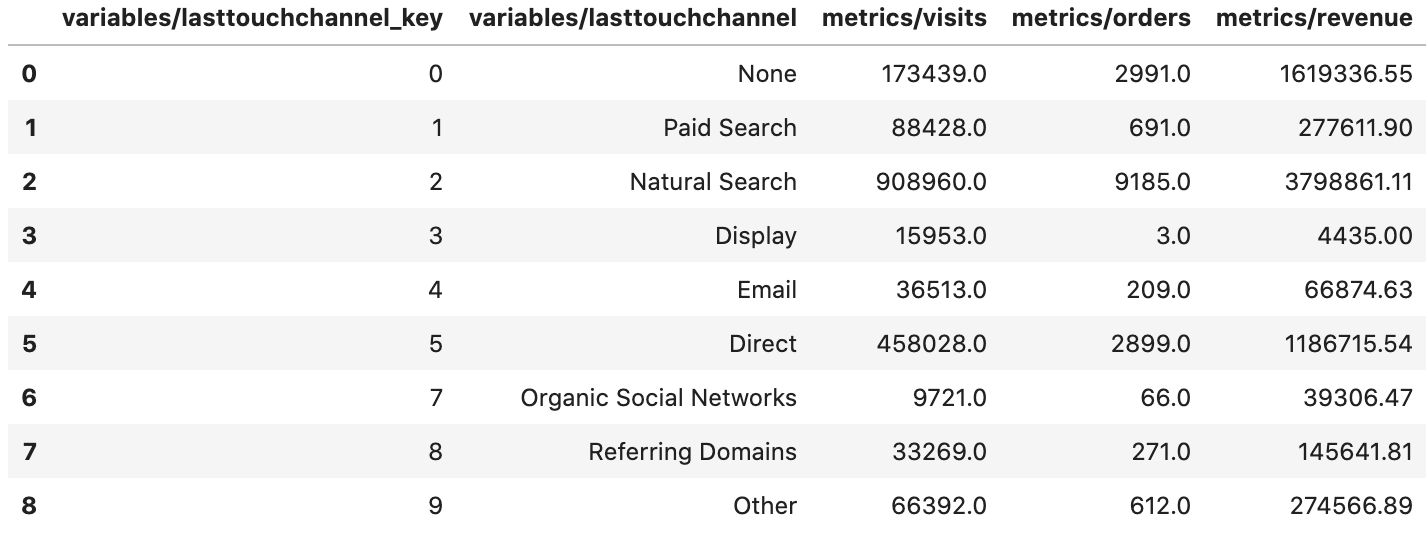
This should be enough to get you started. Our end result is code that authenticates and pulls this table of data. We can now run the code with a scheduler to update this data every day if we like. To pull data with multiple dimensions we'll need to use filters and make multiple API calls. In order to make our code more durable we'll need to consider error checking and API rate limiting. The code shared above is the minimum needed to show how the API works and will need some modifying before use in production.
Related Posts
Using the Adobe Analytics v1.4 API with Python -- the older and actually useful API
Published 2020-12-15
Why would Adobe Analytics give us API 2.0 to use, when it doesn't give access to multiple dimensions in a usable way? It's a mystery to me unless I've missed something 🤷 -- API 1.4 (the Omniture API) to the rescue ⛑️
adobe analyticspythonapi